Sports Drink Comparison Chart
Sports drinks are everywhere these days, and consumption of them is continuing to increase among children. Since much of that consumption appears to have its roots in social settings rather than during sport events, the actual benefits of drinking these beverages has been called into question.To investigate, my team and I researched the most common sports drinks, assessing their nutrient information and compiling it into a simple comparison chart.Here it is! Now let's talk details. Note that all this information is for 12 ounce servings.When it comes to water with juice, the data on the chart above refers to 8 ounces of water and 4 ounces of juice.To calculate the data for water with fruit slices, we added a bottle of water to a half cup of sliced oranges (which look really pretty in a clear water bottle or tumbler) and we assumed you'd eat the oranges after drinking the water. If the oranges go uneaten, then the calorie and sugar count would plummet, as would the potassium.Want to share this information? Here's the downloadable and printable PDF!
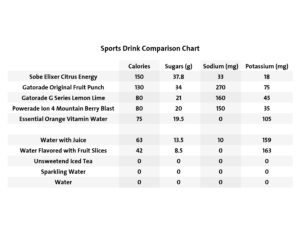 And here are more healthy drink resources from the Nutrition Education Store![shopify embed_type="product" shop="nutrition-education-store.myshopify.com" product_handle="dont-drink-your-calories-powerpoint-and-handout-lesson" show="all"][shopify embed_type="product" shop="nutrition-education-store.myshopify.com" product_handle="beverage-better-poster" show="all"][shopify embed_type="product" shop="nutrition-education-store.myshopify.com" product_handle="sports-nutrition-basics-powerpoint-and-handouts" show="all"]
