Science Project: Satiety
Nicholas DohertyFinal Project ReportWhat happens to the calorie density, satiety, and nutrient makeup of 4 common plant foods as they are more highly processed?For my experiment I studied how processing food affects its calorie density, satiety, and nutrient makeup.• Calorie density is a way to compare various foods by the calories they contain by a specific weight. For example, lettuce would have little calories and Oreo cookies would have a lot if they were compared side by side by their calories per pound. So what is a calorie? A kilocalorie (the food calorie) is the amount of energy needed to raise 1 kilogram of the substance by 1 degree Celsius. This means that high calorie foods require a higher amount of energy to be processed then lower calorie foods. When the body is done processing the food it needs a place to store all of that energy, which it stores as fat as we learned in biology. This experiment also looked at the satiety of the processed and unprocessed food.• Satiety measures how many grams of food required to feel full. So how does this relate to calorie density? Simple. The more food required to feel full, the more calories are consumed and more energy is required for the body to process the food. Finally the project looked at the basic nutrient makeup of the 8 different foods we ate. To test these 4 things 3 volunteers at around the same weight where asked to eat each food until they felt full. This data was recorded for each of the 4 foods. My hypothesis is that the average food consumption of the three volunteers will be much less for the unprocessed version of the food and much higher for the processed, which will result in a lower calorie intake in order to feel full for the unprocessed food.• Nutrient makeup for this experiment consists of comparing calories, fat, sugar and sodium using manufacturer?s and USDA data. My secondary hypothesis is that there is a statistical significance between the correlation of the calorie intake and the amount of grams of food it took to feel full.To test my hypothesis of satiety, each volunteer ate as much as they wanted until they felt full and the amount was recorded. To ensure that each volunteer was hungry and to avoid bias each volunteer was not allowed to eat 2 hours before the test and the test was recorded at the same time of the day, after school for teens. This was done over 8 days and only one food was tested each day. For the potato food, 1/4 cups of mashed potato were lined in front of each volunteer and they would eat as many cups until they felt full. For the french fries 1/4 cup of fries where laid out and each volunteercould eat as many cups as they wanted until they felt full. This process was repeated for each group. To test for calorie density the food was weighed in ounces and the calorie density was the calculated based on the calories consumed. To test the nutrient data the manufacture?s data on the back was used. Sodium content, sugar, and fat where measured.Materials needed:- 1/4 measuring cup- 1/2 measuring cup- 1 cup measuring cup- 4 bowls- small scale- 6 large fries from Mc Donald?s- 10 potatoes- 6 apple pies from Mc Donald?s- 4 apples- 3 large soda drinks from Mc Donald?s- 6 corn on the cobs- 1 box of wheat cereal- 4 bagelsThe satiety of each person for each food group was plotted on a chart for easy comparison and statistical analysis. The results of each person for each food group are shown bellow. The healthier food is on the left side of each table.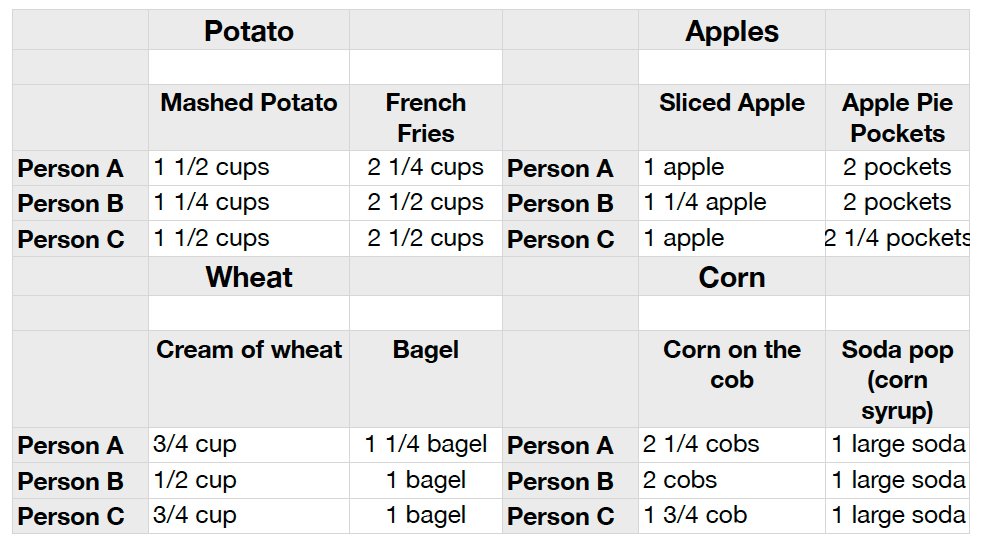 By looking at this chart we can easily see that each volunteer got full on a lot lessfood when eating the unprocessed lower calorie food. So what was the calorie densityof each food and how many calories did each person need to feel full? The averageamount of food for each volunteer was averaged and the average calories for thevolunteers was charted and the calories per pound for each food was calculated. Thefollowing chart shows both of these.
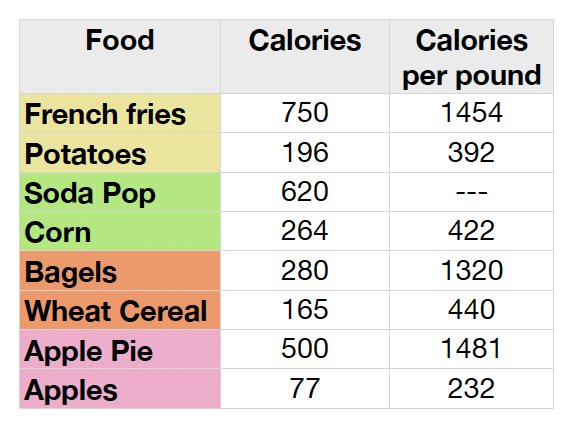 This chart shows that the unprocessed version of the food that the volunteers ate less of to feel full has fewer calories then the processed version of the food that the volunteers needed to eat more of to feel full. The calories per pound are very high for the higher calorie processed food. The calories per pound show how many calories there are in a pound of the food product. The calories per pound for the soda pop could not be calculated because it is a liquid. These two charts of satiety and the calories per pound prove that my hypothesis of being full on fewer calories and less food when eating the unprocessed version of the food is correct. So what was the nutrient content of the food and what else went into out bodies in order for us to feel full? The following chart shows it all!
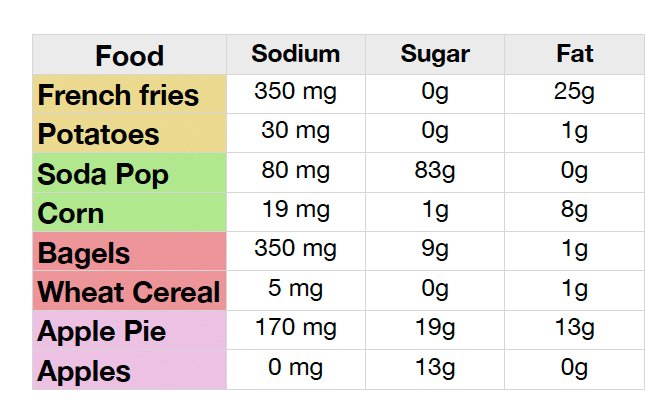 The chart shows that a lot less salt, sugar, and fat was consumed when eating the unprocessed foods. This is important because too much of these 3 things leads to chronic diseases like diabetes and heart problems.!Now that my primary hypothesis has been proven, the secondary one can be tested - that the correlation between calorie intake and the amount in grams of food consumed is statistically significant. I used the product moment correlation coefficient to test this. I chose this that test because it uses the coefficient, r, to determine a correlation between two variables. The null hypothesis is that there is no statistical significance between the correlation of the calorie intake and the amount of the grams of food it took to feel full. The alternative hypothesis is that there is a statistical significance between the correlation of the calorie intake and the amount of the grams of food it took to feel full. The food mass in grams will be represented by ?y? and the calories will be measured by ?x?. The a and y value as well as their squared and multiplied value are shown bellow.
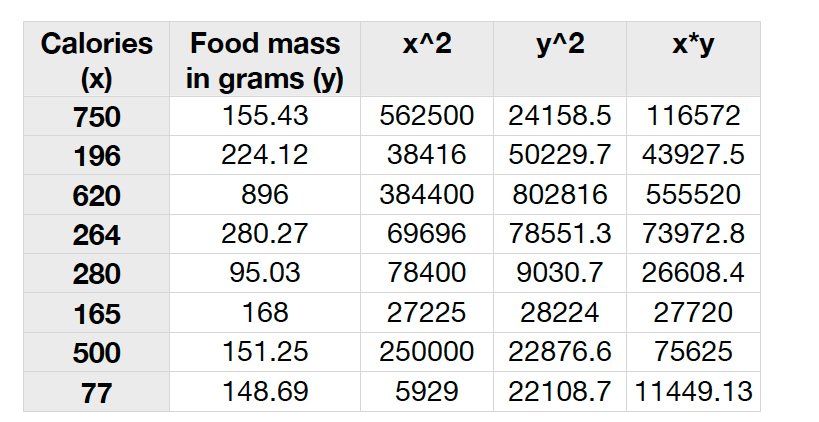 To calculate the product moment correlation coefficient a few parameters are needed. Each of these parameters and their value is shown in the charts bellow.
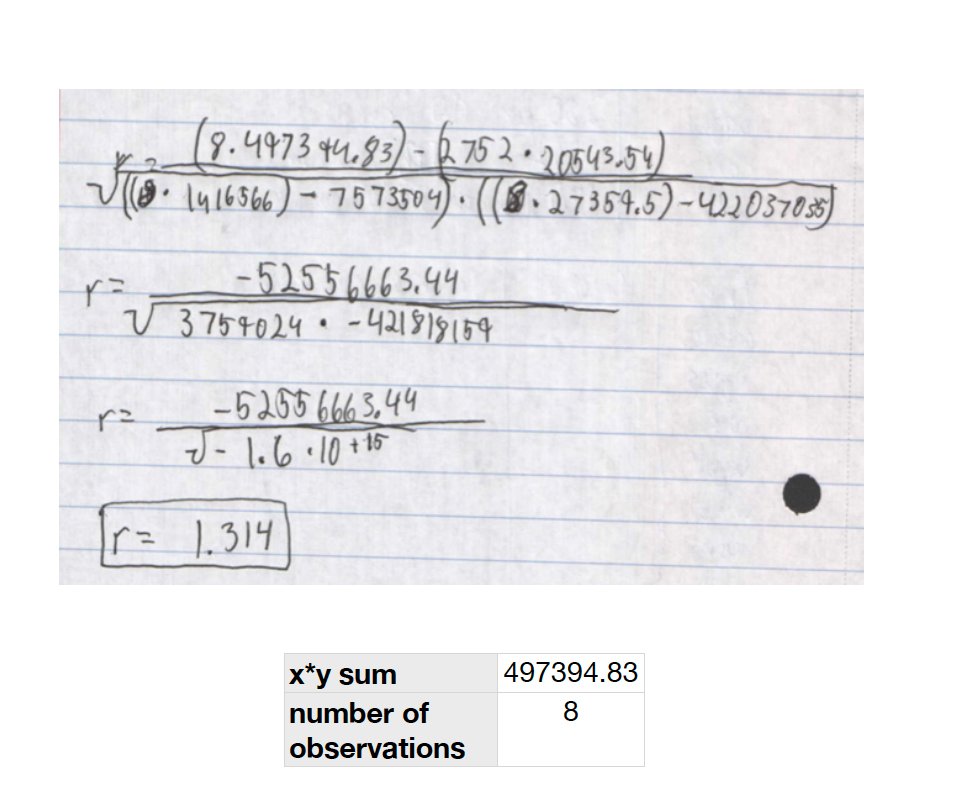 From here the product moment correlation coefficient can be applied and determine if our values are correlated. The formula isr = ((n *xy) - (x * y)) / sqrt(((n * x^2) - (x)^2) * (n * y^s) - (y)^2))The calculation is shown above.When this formula is applied an r value of 1.314 is obtained. Since the number of observations is 8 the degrees of freedom is 6 and According to appendix 5 the ?r? value exceeds the threshold of 0.798, the null hypothesis is rejected and the alternative one is accepted. This confirms my hypothesis that there is a correlation between the calorie intake and the amount of grams of food it took to feel full. In conclusion both hypothesis are proven true. The average food consumption of the three volunteers was much less with the unprocessed version then the processed.This means that less energy was stored in the body and less sugars, fats, and salts where as well. Through looking at the calories per pound we saw the amount of calories or energy the body needs to process the food and that not watching the amount of calories you intake and not burning that many leads to the body storing them. Through statical analysis it was proven that there is a statistical significance between the correlation of the calorie intake and the amount of the grams of food it took to feel full. In future tests I would look deeper into how full you feel after eating a certain weight of each food and then another test of a certain amount of calories, but different weights. I would hypothesize that you feel more full based on the weight and amount of food then the amount of calories.
 ReferencesBlatt, A. D., Roe, L. S., Rolls, B. J., Am J Clin Nutr April 2011 vol. 93 no. 4 756-763http://ajcn.org/content/93/4/756.short?rss=1U.S. Department of Agriculture, Agricultural Research Service. 2010. USDANational Nutrient Database for Standard Reference, Release 23http://www.mcdonalds.com/us/en/food/food_quality/nutrition_choices.htmlPDF FILE FOR THIS PROJECT


