Juice Comparison Chart
Are all juices the same when it comes to health impact? Check out this chart of popular options and see for yourself...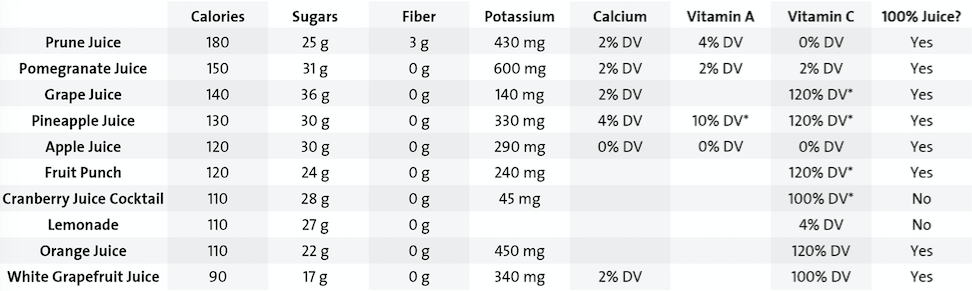 *Fortified: an unfortified version was not available for analysis.Note: All data are for a single 8-ounce serving.If you were to cut any of these juices with water, splitting the drink 50/50 between the two, then you'd be able to halve the sugar content and calories in a single serving. This would bring the average calorie count from 126 to 63, and the average grams of sugar in a serving from 27 to 13.5.If you'd like to share this chart with your audience, this printable PDF makes a great handout, display element, or email blast!
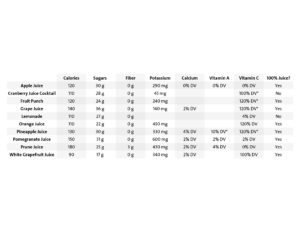 And here are some other great resources from the Nutrition Education Store![shopify embed_type="product" shop="nutrition-education-store.myshopify.com" product_handle="fruit-and-vegetable-challenge-tool-kit-with-powerpoint-shows" show="all"][shopify embed_type="product" shop="nutrition-education-store.myshopify.com" product_handle="freedom-from-chronic-disease-poster-fruit-and-vegetable-promotion-with-statue-of-liberty" show="all"][shopify embed_type="product" shop="nutrition-education-store.myshopify.com" product_handle="12-lessons-wellness-and-weight-loss-program" show="all"]We're here to help you look your very best, right now.
